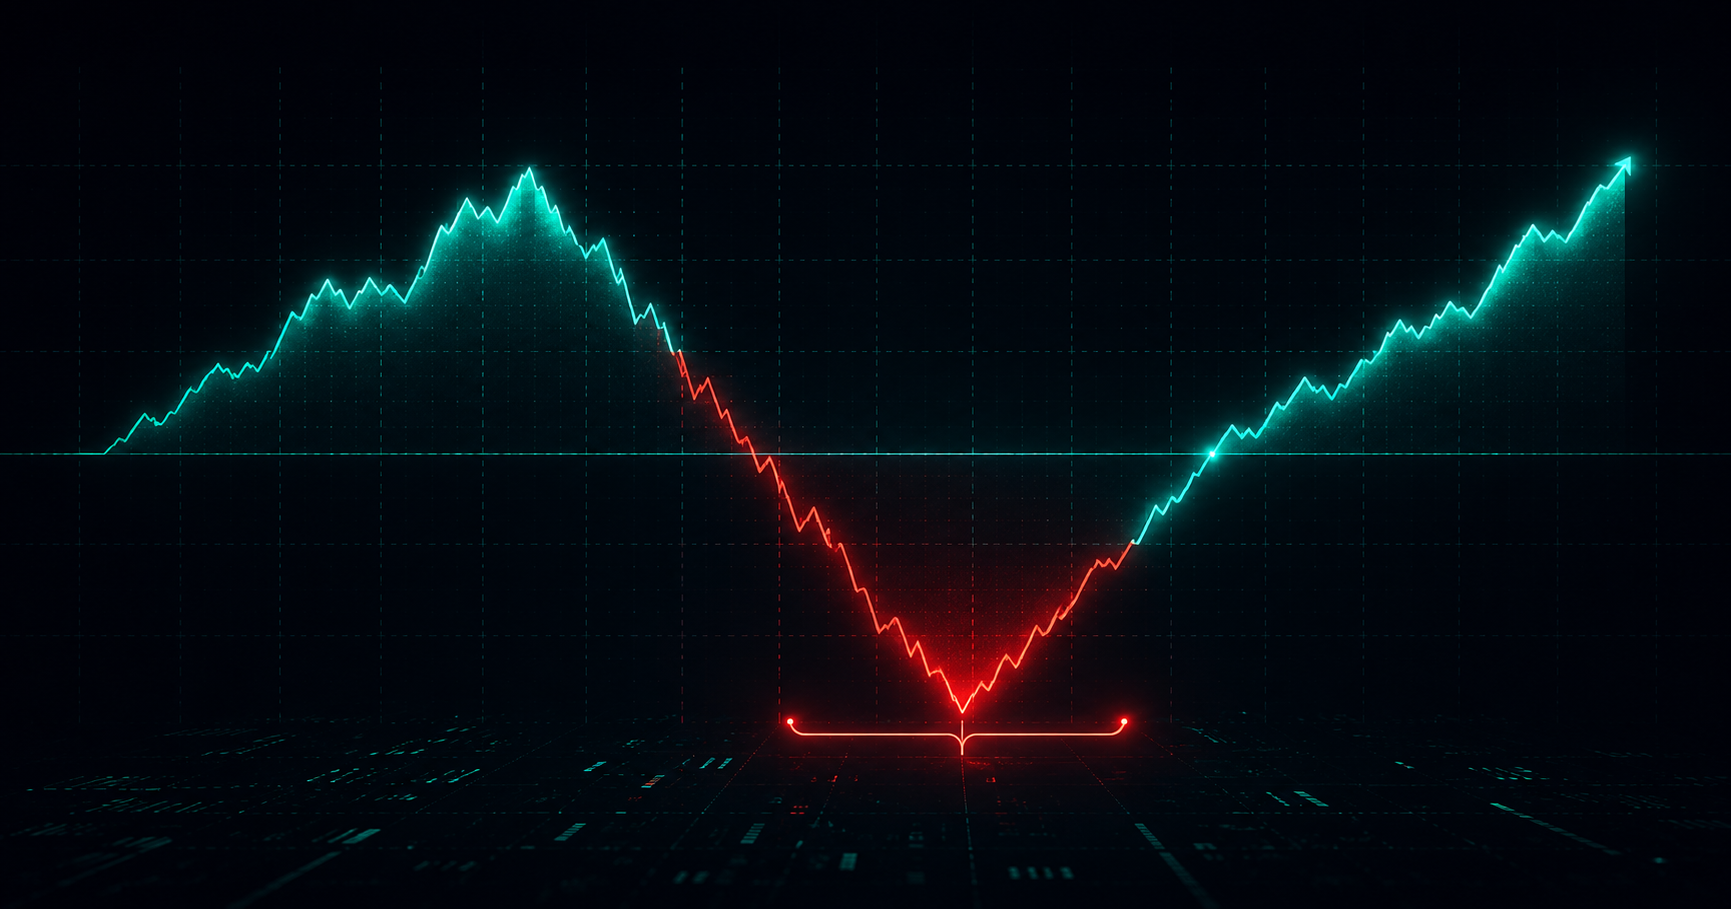
What Is Maximum Drawdown?
Maximum drawdown is the largest percentage decline from a peak to a trough in a strategy's equity curve. It is the most honest metric about the true risk of your trading.
How to Calculate Maximum Drawdown
- List equity after each trade
- Identify each local equity peak
- For each peak, find the lowest subsequent trough before the next new peak
- Calculate: (Peak - Trough) ÷ Peak × 100
- The largest percentage found is the maximum drawdown
Example: Equity went from $10,000 to $13,000 (peak) then fell to $11,050 (trough). Drawdown = (13,000 - 11,050) ÷ 13,000 × 100 = 15%.
Why Maximum Drawdown Matters
It answers the question: if I had started at the worst historical moment, how much would I have lost before recovering? Strategies with max drawdown above 20–25% are psychologically difficult to sustain long-term.
Maximum Drawdown and Prop Firms
At prop firms, your strategy's historical maximum drawdown must be lower than the firm's limit. If your historical drawdown is 12% and FTMO's limit is 10%, any slightly worse losing streak will close your account.
Monitoring Maximum Drawdown with ForexTracker
ForexTracker automatically calculates the maximum drawdown of your equity curve and displays the historical equity chart so you can graphically visualize each peak and trough.
Calculate your maximum drawdown automatically. Access app.forextracker.com.br and log your trades now.